 Several recent studies suggest insects are undergoing unprecedented declines in both abundance and diversity. However, large, well-curated, long-term datasets for understanding the root cause(s) are scarce. Natural History Museums hold over one billion plant and animal specimens worldwide with corresponding metadata indicating the location, date, and other parameters of where specimens were collected. These specimens represent a snapshot of biological communities at a particular time and place, and in aggregate can be used to analyze distributions and long-term community dynamics. However, the information must first be gathered from the labels associated with each specimen.
The Essig Museum houses over five million insect specimens from around the world, with a focus on California. Each specimen has one to several labels with text detailing the where and when of the collection. Once fully digitized these data can be used to analyze the impacts of fires, droughts, pesticide use, urbanization, and other landscape-level disturbances on insect communities in California over the past 100 years.
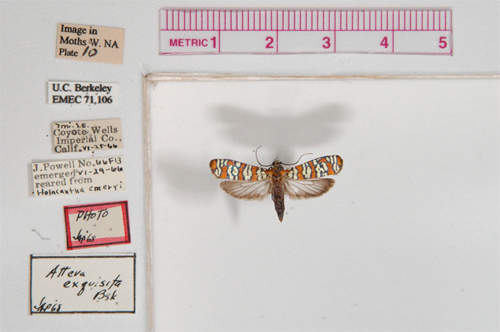
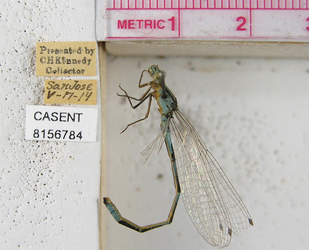
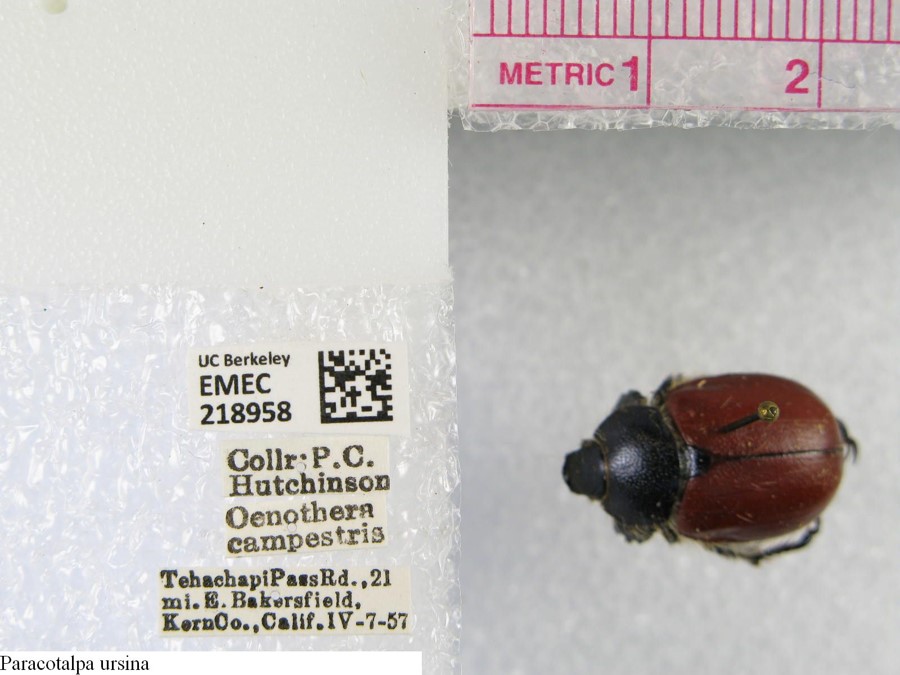
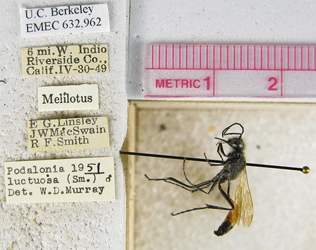
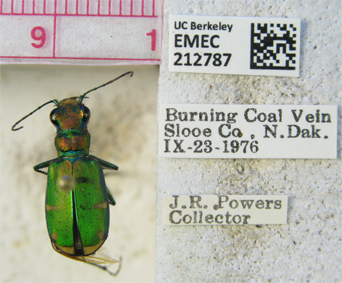
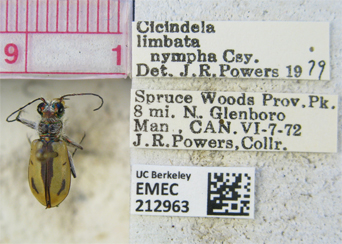
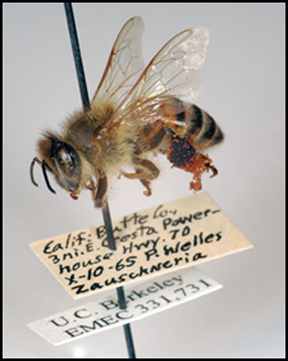
The digitization pipeline begins with photographing specimen labels. Early iterations of label imaging kept labels on the pin below the specimen, which reduced handling time and damage to specimens, but obscured portions of the label (see above example). Current imaging protocols include removing labels and laying them flat next to the specimen (see examples below). Overall quality of images improved over the past ten years as imaging rigs evolved and protocols were refined.
Label data (Country, State, County, Location, Date, Collector, Host/Habitat, Elevation, Collecting Method, etc.) are transcribed into database fields that follow Darwin Core standards. Some fields, such as Country, State, County, and Date have controlled vocabularies, while others such as Location and Habitat are more variable. To date, over 100,000 transcriptions have been completed by direct keyboard entry either by museum staff, students, and volunteers, or by citizen scientists through our Notes From Nature data entry portal.
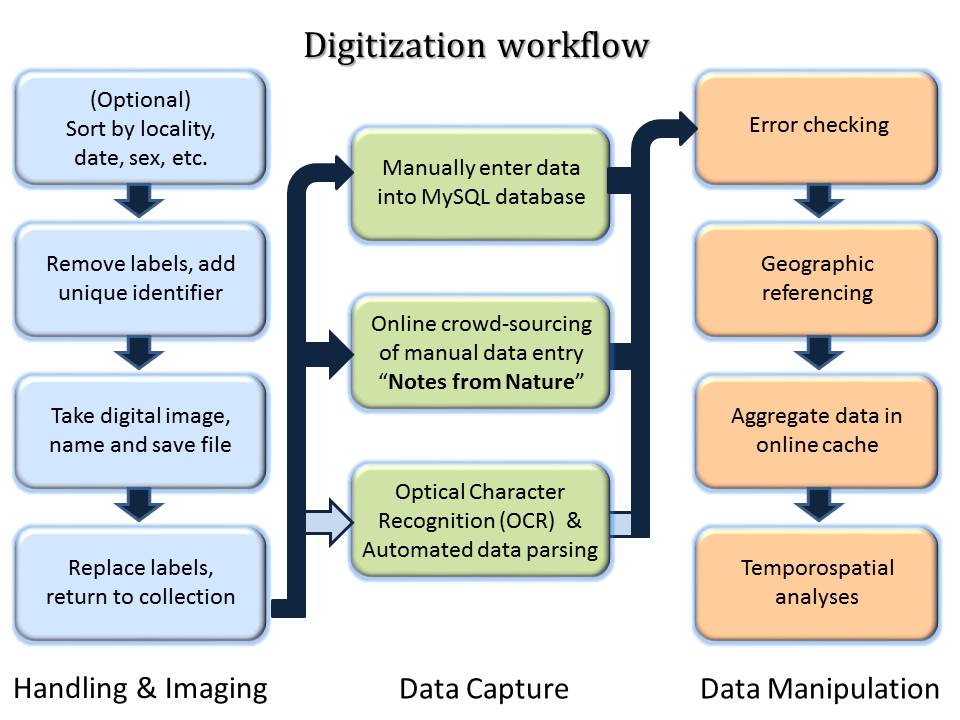 Labels may be handwritten, machine type, or some combination of these two. Most labels are at least 70-90% machine type, making optical character recognition a viable strategy for automating digitization. However, the resulting text string needs to be parsed into the proper fields. Adding to the challenge, due to the size of the labels, much of the information is highly abbreviated, varies in the order of presentation of data elements, and some elements (eg. Country) are sometimes omitted.
The challenge is to automate the capture of text data from images and parse the resulting string into particular data fields. Transcribed data can then be georeferenced using semi-automated services such as GeoLocate, and analyzed for trends related to land use patterns, climate, and other landscape disturbances.
Training sets are available that include label images and the resulting transcription. For more details please contact Peter Oboyski (poboyski@berkeley.edu).